
Table of Contents
Performance Analytics: The Ultimate Guide to Measuring Success
Performance analytics has become an essential part of modern business, technology, and digital decision-making. Organizations generate massive amounts of data every day, but data alone has little value unless it is analyzed and transformed into meaningful insights. This is where performance analytics plays a crucial role by helping businesses measure efficiency, identify trends, and improve overall performance.
Whether you’re managing a website, monitoring employee productivity, optimizing business operations, or analyzing application performance, performance analytics provides actionable insights that support better decision-making. As companies increasingly rely on data-driven strategies, the demand for advanced performance analytics tools continues to grow across industries.
What Is Performance Analytics?
Performance analytics is the process of collecting, measuring, analyzing, and visualizing performance-related data to evaluate how effectively a system, team, application, or business achieves its goals.
Rather than simply displaying raw metrics, performance analytics transforms data into meaningful reports, dashboards, forecasts, and recommendations that help organizations improve efficiency and productivity.
Definition and Background
The concept of performance analytics evolved alongside business intelligence (BI) and data analytics technologies. Initially, organizations relied on spreadsheets and manual reporting. Today, cloud computing, artificial intelligence (AI), machine learning, and automation have made performance analytics faster, more accurate, and accessible.
Modern performance analytics tools continuously monitor key performance indicators (KPIs) and generate real-time insights that help organizations react quickly to changing conditions.
Purpose and Relevance
The primary purpose of performance analytics is to answer important business questions such as:
- Are current goals being achieved?
- Which processes need improvement?
- What trends are emerging?
- Where are resources being wasted?
- How can performance improve over time?
Performance analytics is now widely used in:
- Business management
- IT operations
- Software development
- Digital marketing
- Healthcare
- Manufacturing
- Education
- Financial services
- Customer support
- Website optimization
Key Features of Performance Analytics
Modern performance analytics platforms include a variety of powerful capabilities.
Real-Time Data Monitoring
Monitor systems, applications, employees, or business operations as events happen.
Interactive Dashboards
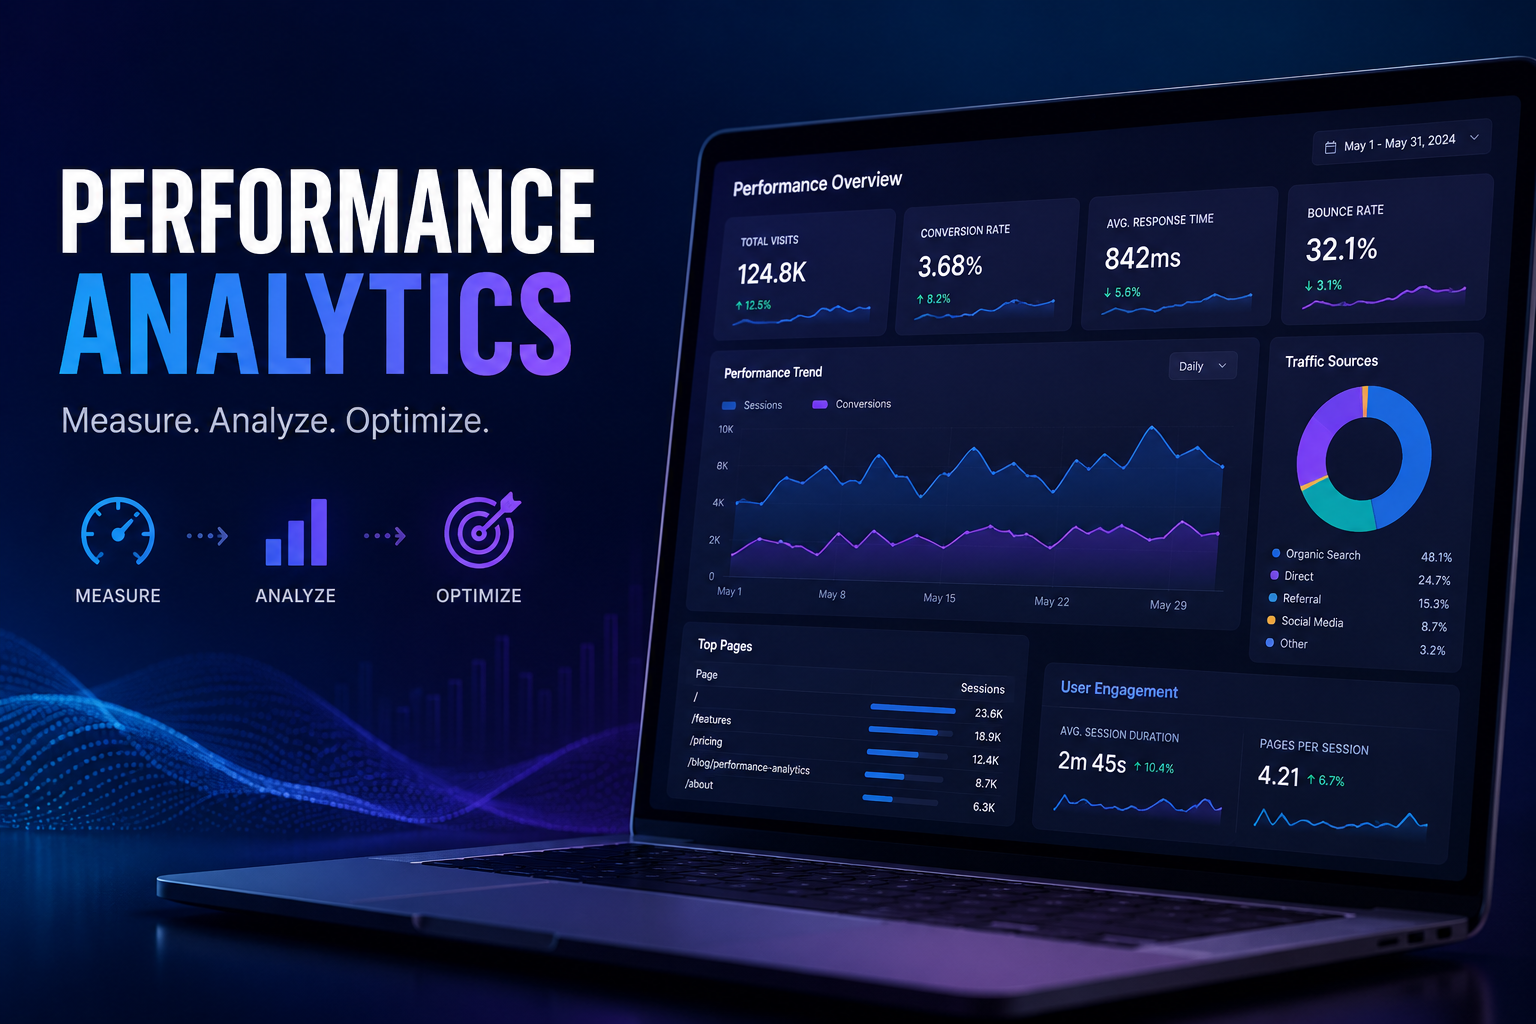
Visual dashboards make complex information easy to understand using:
- Charts
- Graphs
- Scorecards
- KPI widgets
- Heatmaps
KPI Tracking
Organizations can monitor important metrics including:
- Revenue
- Customer satisfaction
- Website traffic
- Conversion rates
- Productivity
- Application response time
Trend Analysis
Historical data helps identify:
- Seasonal patterns
- Performance improvements
- Declining efficiency
- Growth opportunities
Predictive Analytics
Many performance analytics tools use AI to forecast:
- Future demand
- Sales projections
- Resource requirements
- Risk factors
Automated Reporting
Instead of creating reports manually, analytics software can automatically generate:
- Daily reports
- Weekly summaries
- Monthly performance reviews
Alerts and Notifications
Users receive automatic notifications when:
- KPIs fall below targets
- Servers experience issues
- Website traffic suddenly changes
- Business goals are exceeded
Unique Aspects That Differentiate Performance Analytics
Performance analytics goes beyond basic reporting by focusing on continuous improvement rather than simply displaying numbers.
Key differentiators include:
- Real-time monitoring
- Automated data collection
- AI-powered forecasting
- Interactive dashboards
- KPI benchmarking
- Root cause analysis
- Historical comparisons
- Custom performance scoring
Unlike simple analytics dashboards, performance analytics helps explain why performance changes and how improvements can be made.
How Performance Analytics Works
Performance analytics follows a structured process to transform raw data into valuable insights.
Step 1: Data Collection
Data is gathered from multiple sources, including:
- Databases
- Applications
- Websites
- IoT devices
- CRM software
- ERP systems
- Cloud platforms
Step 2: Data Processing
The collected information is cleaned and organized by removing:
- Duplicate records
- Invalid entries
- Missing values
- Inconsistent formats
Step 3: Performance Measurement
Key metrics are calculated based on predefined KPIs.
Examples include:
- Sales growth
- Customer retention
- Server uptime
- Page load speed
- Employee productivity
Step 4: Data Visualization
The processed data is presented through:
- Graphs
- Dashboards
- Tables
- Reports
- Interactive charts
Step 5: Insight Generation
Analytics software identifies:
- Trends
- Bottlenecks
- Opportunities
- Risks
- Performance gaps
Step 6: Decision Making
Managers use these insights to improve strategies, optimize workflows, and allocate resources more effectively.
Technical Overview (Simple Language)
Although performance analytics involves advanced technologies, the basic workflow is straightforward:
- Collect data.
- Store the information securely.
- Analyze patterns using software.
- Display results visually.
- Generate recommendations.
- Improve business performance.
Modern performance analytics platforms often integrate with:
- Artificial Intelligence (AI)
- Machine Learning
- Cloud Computing
- APIs
- Big Data technologies
- Business Intelligence software
Benefits of Using Performance Analytics
Performance analytics offers numerous advantages for organizations of all sizes.
Better Decision Making
Managers make informed decisions based on accurate data instead of assumptions.
Increased Productivity
Performance bottlenecks become easier to identify and eliminate.
Improved Customer Experience
Businesses can monitor customer satisfaction and quickly address service issues.
Cost Reduction
Analytics helps identify:
- Waste
- Inefficient workflows
- Underperforming resources
Faster Problem Detection
Real-time monitoring enables teams to respond immediately to unexpected issues.
Improved Forecasting
Historical trends help predict future outcomes with greater accuracy.
Continuous Improvement
Organizations can consistently measure progress toward long-term goals.
Practical Use Case
Performance analytics is used across many industries.
Business Operations
Monitor employee productivity, project completion, and operational efficiency.
Website Analytics
Track:
- Visitor behavior
- Bounce rates
- Conversion rates
- Loading speed
IT Infrastructure
Measure:
- Server performance
- Network reliability
- System uptime
- Application health
Marketing Campaigns
Analyze:
- Ad performance
- Return on investment (ROI)
- Customer acquisition
- Engagement metrics
Software Development
Development teams monitor:
- Application performance
- Error rates
- Deployment success
- User experience
Popular Performance Analytics Tools
Several performance analytics tools help organizations measure and optimize performance.
Google Analytics
A popular platform for website traffic analysis, user behavior, and conversion tracking.
Microsoft Power BI
Business intelligence software for creating interactive dashboards and reports.
Tableau
A powerful data visualization platform that simplifies complex analytics.
Grafana
Widely used for monitoring infrastructure, applications, and cloud environments.
Datadog
Cloud monitoring software offering performance tracking, infrastructure monitoring, and application analytics.
New Relic
Designed for application performance monitoring with detailed insights into software behavior.
Splunk
Analyzes machine-generated data for security, IT operations, and performance management.
How to Get Started
Starting with performance analytics is easier than many beginners expect.
Step 1: Define Your Goals
Identify what you want to measure, such as:
- Sales
- Website traffic
- Customer support
- Productivity
- Application speed
Step 2: Choose the Right Performance Analytics Tools
Select tools that match your business size, budget, and technical requirements.
Step 3: Connect Data Sources
Integrate your software, databases, websites, and cloud services into your analytics platform.
Step 4: Create Dashboards
Build customized dashboards to display your most important KPIs.
Step 5: Monitor Results
Review reports regularly and make adjustments based on insights.
Tips for Beginners
If you’re new to performance analytics:
- Start with a few important KPIs.
- Keep dashboards simple.
- Focus on measurable goals.
- Review reports consistently.
- Learn basic data visualization.
- Automate reporting whenever possible.
- Continuously refine your metrics.
Pros and Cons
Pros
- Supports data-driven decisions
- Improves productivity
- Real-time monitoring
- Automated reporting
- Predictive insights
- Easy-to-understand dashboards
- Better resource management
- Scalable for growing organizations
Cons
- Initial setup may require time.
- High-end platforms can be expensive.
- Poor data quality affects accuracy.
- Staff may require training.
- Complex dashboards can overwhelm beginners.
Common Issues and Troubleshooting
Although performance analytics systems are reliable, users may encounter occasional challenges.
Inaccurate Data
Cause:
Poor data quality or incorrect integrations.
Solution:
Regularly validate and clean incoming data.
Dashboard Loading Slowly
Cause:
Large datasets or inefficient queries.
Solution:
Optimize data sources and archive outdated records.
Missing Reports
Cause:
Disconnected integrations or synchronization errors.
Solution:
Reconnect data sources and verify scheduled imports.
Incorrect KPIs
Cause:
Improper metric configuration.
Solution:
Review KPI definitions and ensure calculations align with business objectives.
Too Much Data
Cause:
Collecting unnecessary metrics.
Solution:
Focus only on KPIs that directly support your goals.
Future of Performance Analytics
Performance analytics continues to evolve rapidly as new technologies reshape how organizations use data.
Several important trends are expected to influence the future.
Artificial Intelligence
AI will automate deeper analysis and generate more accurate recommendations.
Predictive Analytics
Forecasting models will become increasingly accurate using machine learning.
Real-Time Decision Making
Organizations will rely on instant analytics for faster responses.
Cloud-Based Analytics
Cloud platforms will continue making advanced analytics more affordable and scalable.
Self-Service Analytics
Non-technical users will gain easier access to powerful reporting tools without requiring programming knowledge.
Automation
Routine reporting and performance monitoring will become almost entirely automated.
Performance Analytics Best Practices
To maximize the value of performance analytics:
- Define clear business objectives.
- Monitor meaningful KPIs.
- Ensure high-quality data.
- Automate repetitive reporting.
- Review dashboards regularly.
- Encourage data-driven decision-making.
- Continuously improve analytics processes.
- Train team members on analytics tools.
Conclusion
Performance analytics has become one of the most valuable technologies for organizations seeking to improve efficiency, productivity, and decision-making. By transforming raw data into actionable insights, businesses can monitor key performance indicators, identify opportunities for growth, and resolve issues before they become major problems.
Whether you’re tracking website traffic, monitoring application performance, measuring employee productivity, or optimizing business operations, the right performance analytics tools can deliver measurable improvements. As artificial intelligence, automation, and predictive analytics continue to advance, performance analytics will become even more powerful and accessible for organizations of every size.
If you’re ready to make smarter, data-driven decisions, now is the perfect time to explore performance analytics, experiment with modern performance analytics tools, and build a strategy that supports continuous improvement and long-term success.